


The debut of SpaceX (SPCX) on the Nasdaq on June 12, 2026, was not merely the largest IPO in financial market history; it was the birth certificate of a brand-new asset class on Wall Street. The capital markets have stopped evaluating SpaceX as a speculative aerospace company and have begun pricing it for what it truly represents: an absolute monopoly over low-Earth orbit data infrastructure and the core connectivity vector for the global Artificial Intelligence ecosystem.
To understand the institutional flow driving Smart Money into this asset, we must break down the fundamental and macroeconomic anatomy of this public restructuring:
1. Starlink: The True Macro Cash Cow
Forget the rockets. Starlink is the backbone generating the predictable cash flow that has captured the attention of sovereign wealth funds and major pension funds across the NYSE and Nasdaq. Controlling over 65% of all active satellites in space, SpaceX holds an insurmountable barrier to entry (Moat).
While the retail market remains fixated on residential subscriptions, institutional capital is focused on the corporate and military sectors. Multi-year contracts signed with global maritime fleets, commercial aviation, and, crucially, the US Department of Defense via the classified Starshield network, secure high-margin recurring revenue. SpaceX has successfully transitioned from burning capital to operating as a highly predictable liquidity-generating machine.
2. The Hidden Correlation with the AI Supercycle
There is a direct infrastructure correlation between AI computing and SpaceX that most amateur analysts completely overlook. As Artificial Intelligence models shift toward decentralized architectures (Edge Computing) and autonomous vehicle fleets or advanced robotics require ultra-low latency anywhere on Earth, terrestrial fiber optics become insufficient and geographically limited.
Starlink’s inter-satellite laser network functions as a low-Earth orbit data superhighway, allowing global servers to communicate at the speed of light without the physical routing delays of transoceanic cables. SpaceX provides the network arterial system that enables the global expansion of computational intelligence outside urban centers.
3. Institutional Dynamics and Wall Street Float Structure
The IPO execution was highly strategic. Elon Musk retained majority voting control, but the public float release opened the doors for massive inflows from top-tier institutional asset managers (such as BlackRock, Vanguard, and Fidelity).
The intense buying pressure observed following the IPO was heavily driven by immediate indexation mandates. Large-cap growth funds and advanced technology ETFs were structurally forced to aggressively accumulate SPCX to prevent tracking errors against their benchmarks. Heavy institutional block volume during market opens and closes confirms that shares are being accumulated and locked into long-term portfolios. This absorption reduces secondary market liquidity, creating a “scarcity effect” that structurally amplifies technical bounces.
Technical Analysis Framework & Price Action Dynamics
With the macroeconomic and institutional foundation established, price action and volume profiles dictate market structural behavior. Analyzing the order flow and ticker tape of SPCX since inception reveals key mechanical patterns.
Technical Analysis & Core Indicators
Momentum & Trend Strength Indicators:
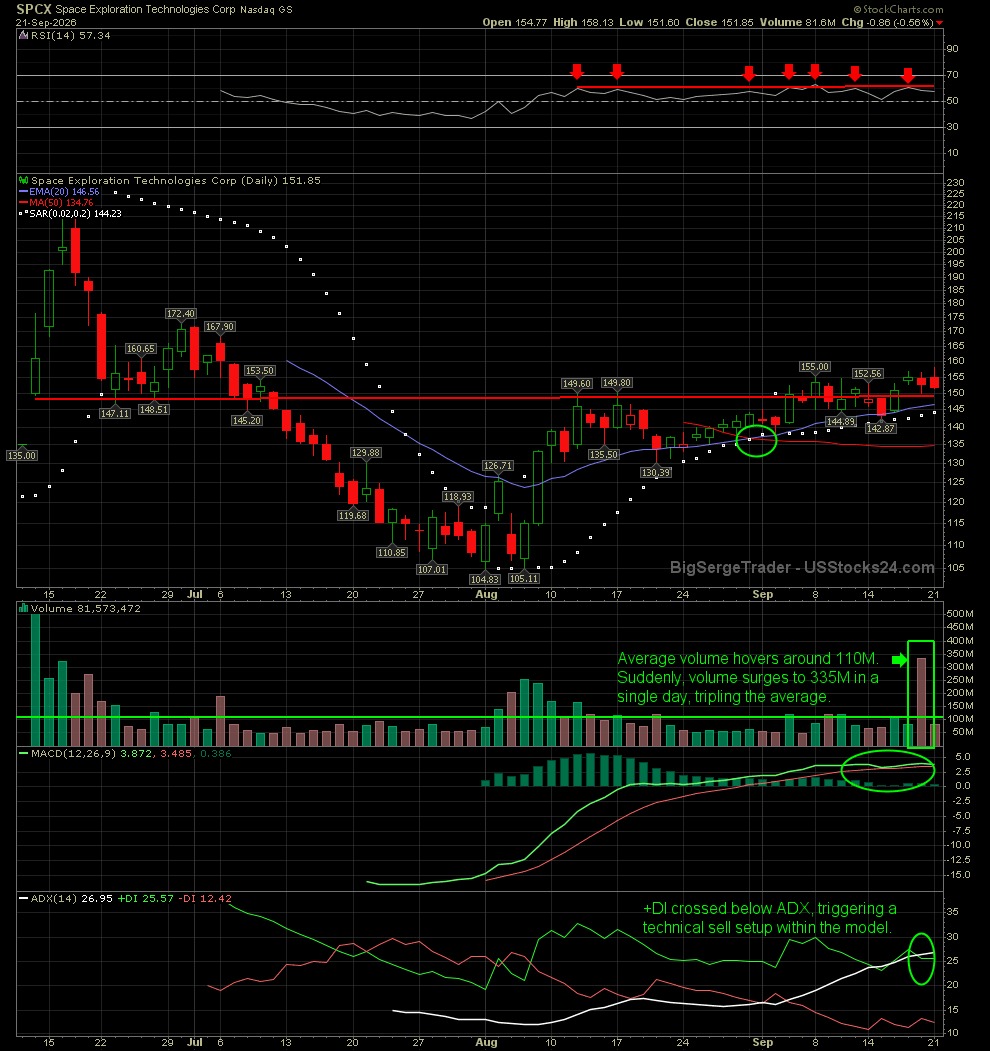
RSI (Relative Strength Index): As illustrated on the chart by the red horizontal resistance line and tracking arrows, the RSI is encountering a well-defined ceiling between the 60 and 62 levels. The index has tested this zone seven distinct times, reversing downward on each occasion. Structurally, this recurring rejection establishes a technical overhead resistance barrier (bearish undertone).
MACD (Moving Average Convergence Divergence): The MACD profile presents a divergent bullish alignment. The signal line (green) remains positioned above the main MACD line (red), confirming short-to-medium term positive price momentum.
ADX (Average Directional Index): The mechanical breakdown on the chart shows the +DI line (green) crossing below the main ADX trend-strength line (white). Within modern momentum theory, this crossover indicates an exhaustion of buying pressure and characterizes a structural sell setup, suggesting potential downward distribution.
Trend Overlays:
EMA 20 (Exponential Moving Average): Price action is currently sustaining above the 20-day EMA, signaling positive short-term structural support. Furthermore, approximately two weeks ago, the 20 EMA executed a crossover above the 50-day SMA. This short-to-medium-term crossover structurally reinforces near-term upward momentum.
SMA 50 (Simple Moving Average): The underlying asset continues to trade above its 50-day SMA, which represents a constructive technical backdrop for the medium term. However, the moving average slope remains slightly flat to descending, suggesting that a macro trend has not fully consolidated. The configuration points toward an ongoing multi-week price consolidation.
Parabolic SAR (Stop and Reverse): Price architecture remains tracking above the Parabolic SAR dots, with each white indicator point representing a daily session. Historically, maintaining price action above the SAR framework reflects a sustained structural floor.
Volume & Liquidity Profiles:
Volume remains the most critical leading indicator within this execution framework. When correlated with dynamic overlays, significant volume spikes serve as a leading alert for immediate volatility expansion.
As annotated on the chart, daily volume surged to 335M last Friday—exactly tripling the historical 110M average. A volume expansion of this magnitude indicates an imminent structural breakout or breakdown, forcing price action out of its current consolidation range to test either macro support or overhead resistance.
Market Outlook & Technical Resolution
The current technical matrix presents a highly nuanced, mixed sentiment across multiple time-frames. While the structural moving averages and momentum overlays preserve their near-term constructive alignments, the concurrent momentum rejections present structural risks.
Given the significant volume expansion observed during last Friday’s distribution session—where the market formed a decisive red candle, closing negative at the bell—the balance of probabilities tilts toward a testing of lower structural bounds. When this volume profile is synthesized with the active +DI bearish crossover and the RSI’s rejection from its 62 ceiling (leaving substantial technical room to retest the median 50 level), the technical setup mathematically favors a downside expansion and a test of major support levels.
A invalidation of this immediate bearish setup would require substantial corporate catalyst flow or fundamental news flow over the coming sessions to shift institutional order flow back toward accumulation.
⚠️ Institutional Disclaimer
All chart studies, technical breakdowns, and volume profile metrics published by USStocks24.com are intended strictly for educational and informational purposes. This analysis does not constitute investment advice, trading recommendations, or an endorsement to buy or sell securities. Trading US equities involves significant risk of capital loss. Past performance is not indicative of future market results.
🎯 Unlock Full Market Intelligence
The institutional tape doesn’t wait for retail to catch up. Don’t base your trading execution on amateur noise.
Subscribe to USStocks24.com to receive advanced volume profiles, institutional chart setups, and raw technical data directly in your inbox before the opening bell.
Trade safely,
BigSerge
Founder, USStocks24.com
Join serious traders getting institutional-grade technical analysis.